OrgDrafter vs. Lucidchart
Your org chart should do math, not just diagram it.
Lucidchart is a capable diagramming tool, but an org chart drawn in it is a picture you maintain by hand. The moment headcount or budget shifts, the diagram goes stale. OrgDrafter is a live modeling environment: move a node and payroll, run-rates, and spans recalculate instantly.
OrgDrafter vs. Lucidchart, at a glance
| Capability | Lucidchart | OrgDrafter |
|---|---|---|
| What a box represents | A diagram shape you connect and lay out by hand | A real role with cost, level, and reporting data |
| Keeping it current | Re-import or redraw whenever the org changes | Connected to live data — the model stays true |
| Cost & budget tracking | None — you track it elsewhere | Fully-loaded cost live on the canvas |
| Spans & layers | Counted manually, if at all | Audited automatically with tunable benchmarks |
| Scenario modeling | Duplicate the diagram and redraw | Compare future-state scenarios side by side |
| Conversational AI | Generic diagram assistance | Ask AI to restructure the org and price the change |
A modeling canvas, not a diagram.
In Lucidchart, an org chart is a diagram you build and re-arrange by hand. Even with a data import, it's a snapshot — only ever as current as the last time someone refreshed it.
OrgDrafter's canvas is connected to live data. Drag a role, restructure a team, or collapse a layer, and the model stays true — structure and data move together, every time.
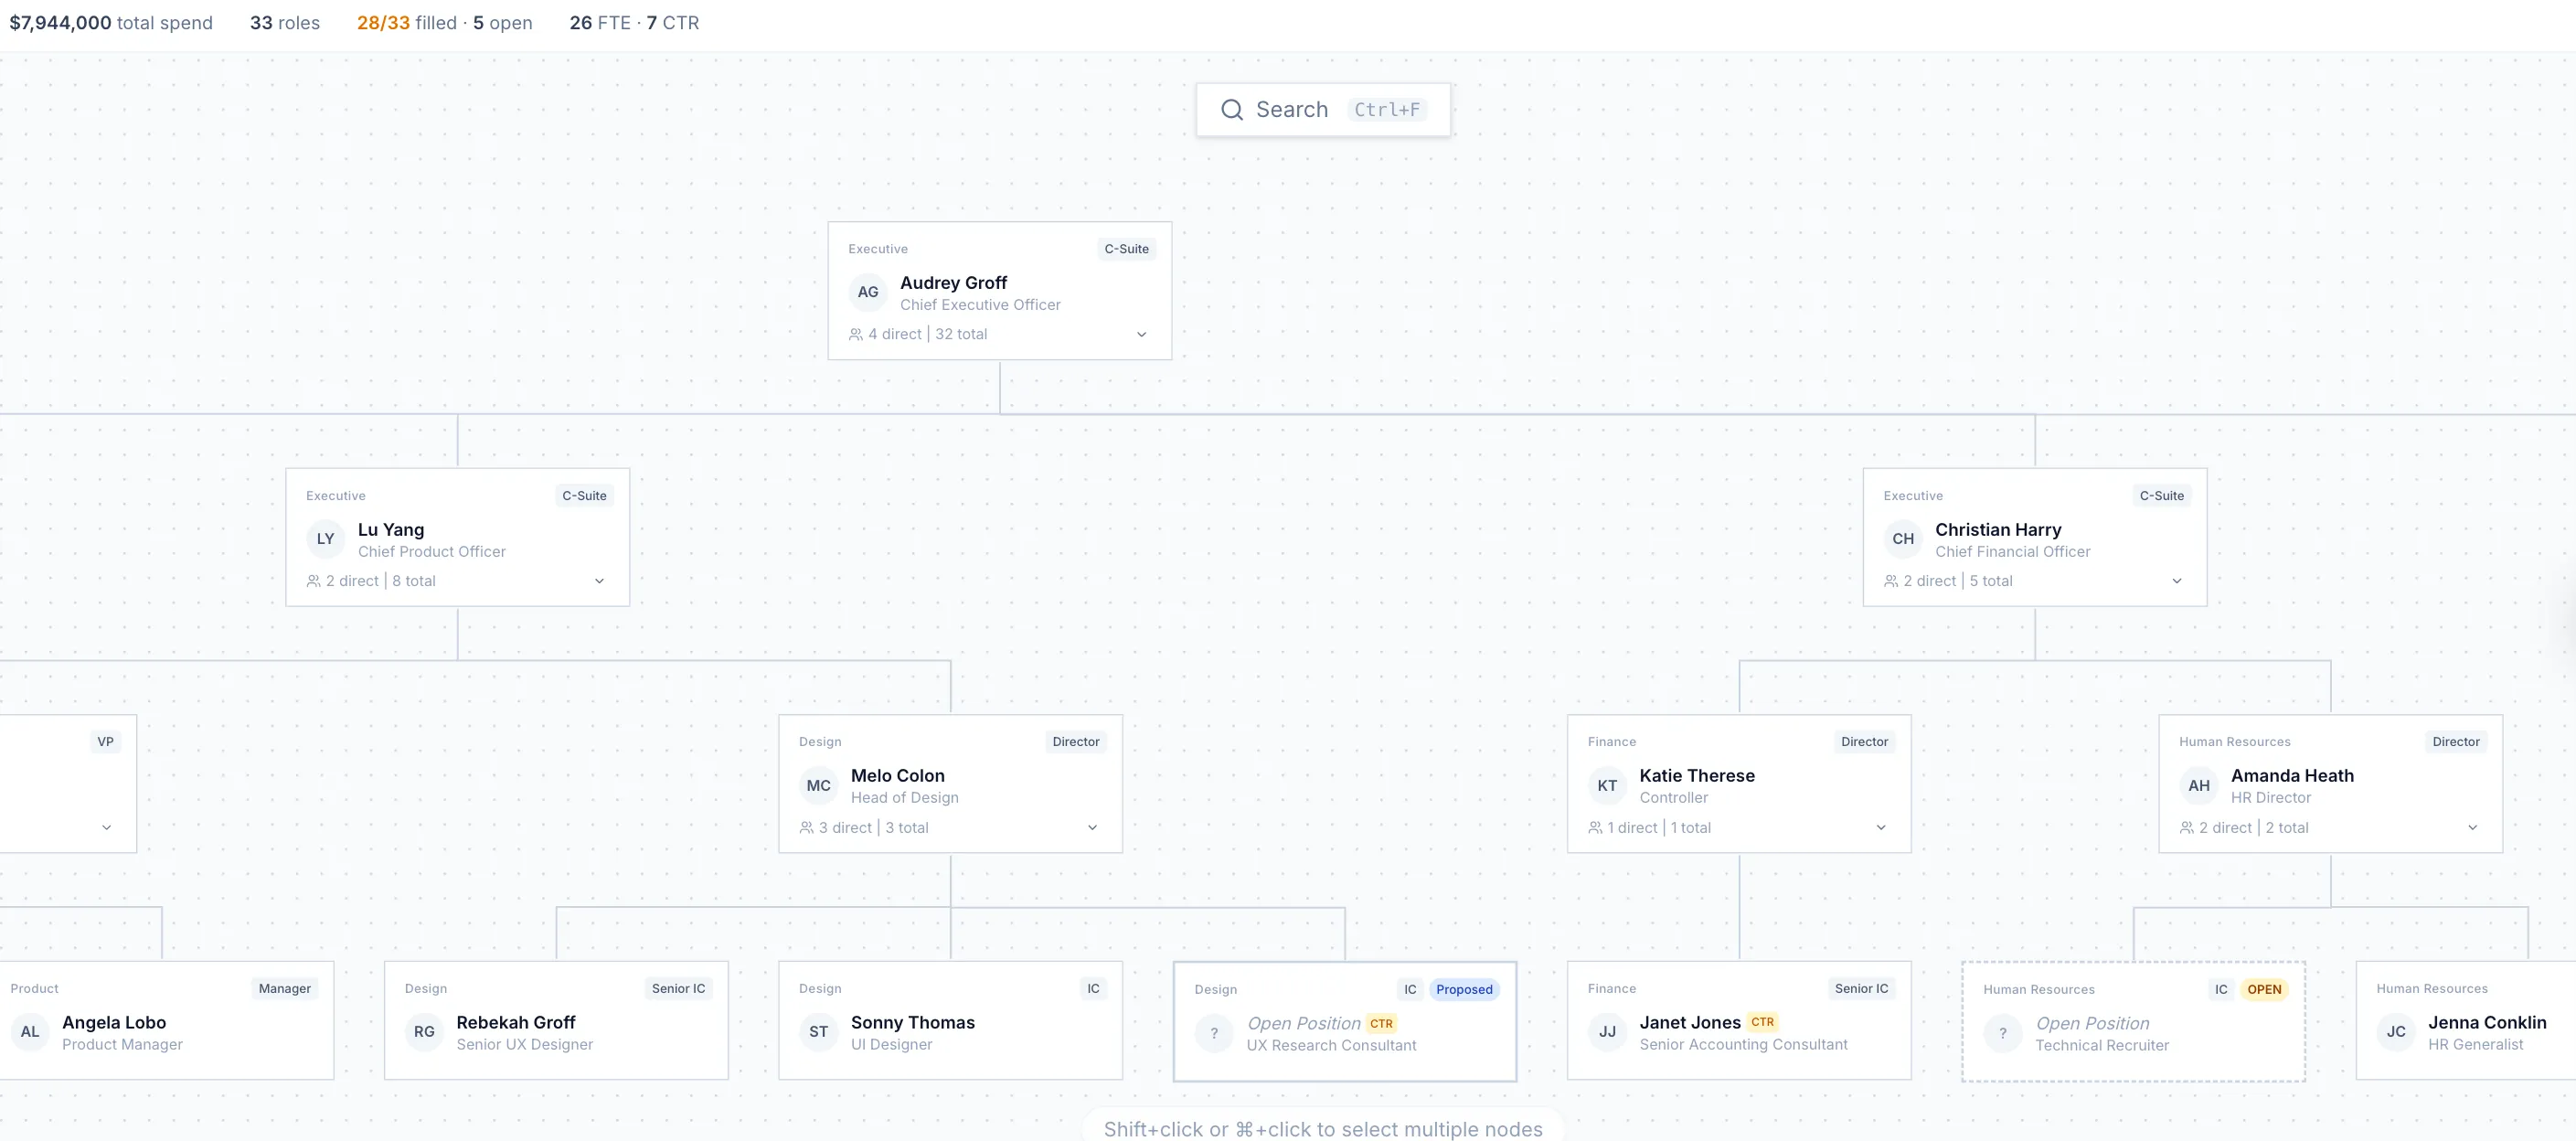
Move a node, watch payroll update.
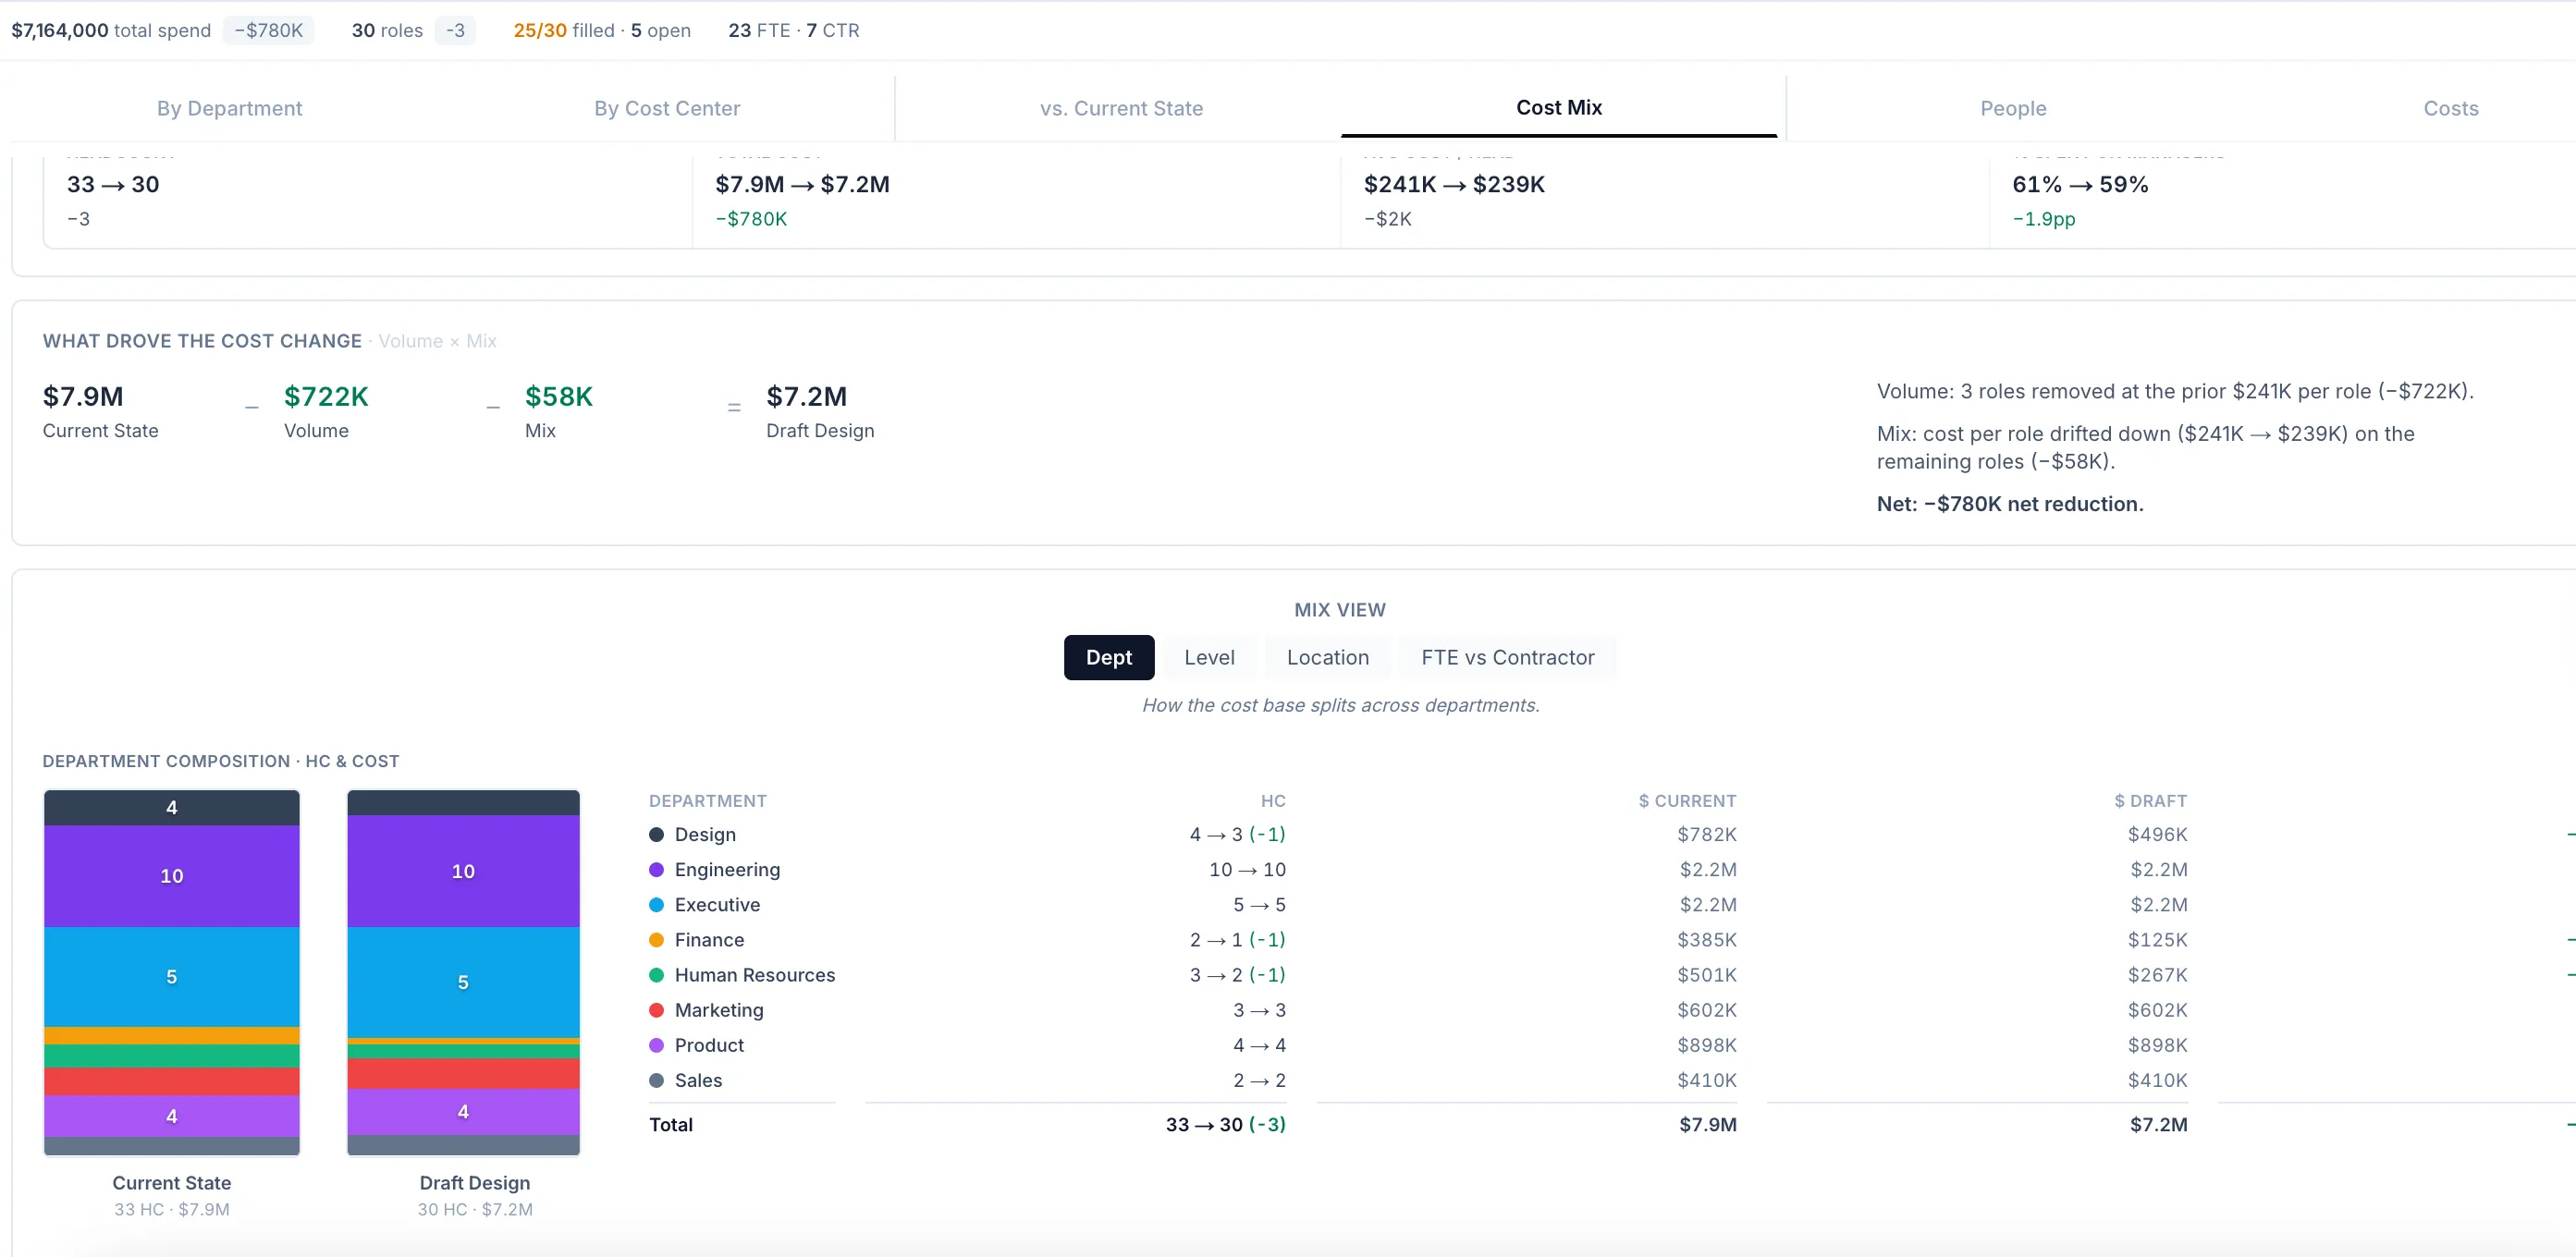
Reorganizing in a diagramming tool tells you nothing about cost. You rearrange boxes, then go rebuild the budget in a separate spreadsheet to find out what the change means.
In OrgDrafter, structure and financials are one model. Every change instantly recalculates run-rate and fully-loaded cost, so the financial impact of a reorg is visible as you design it.
Spans and layers, audited automatically.
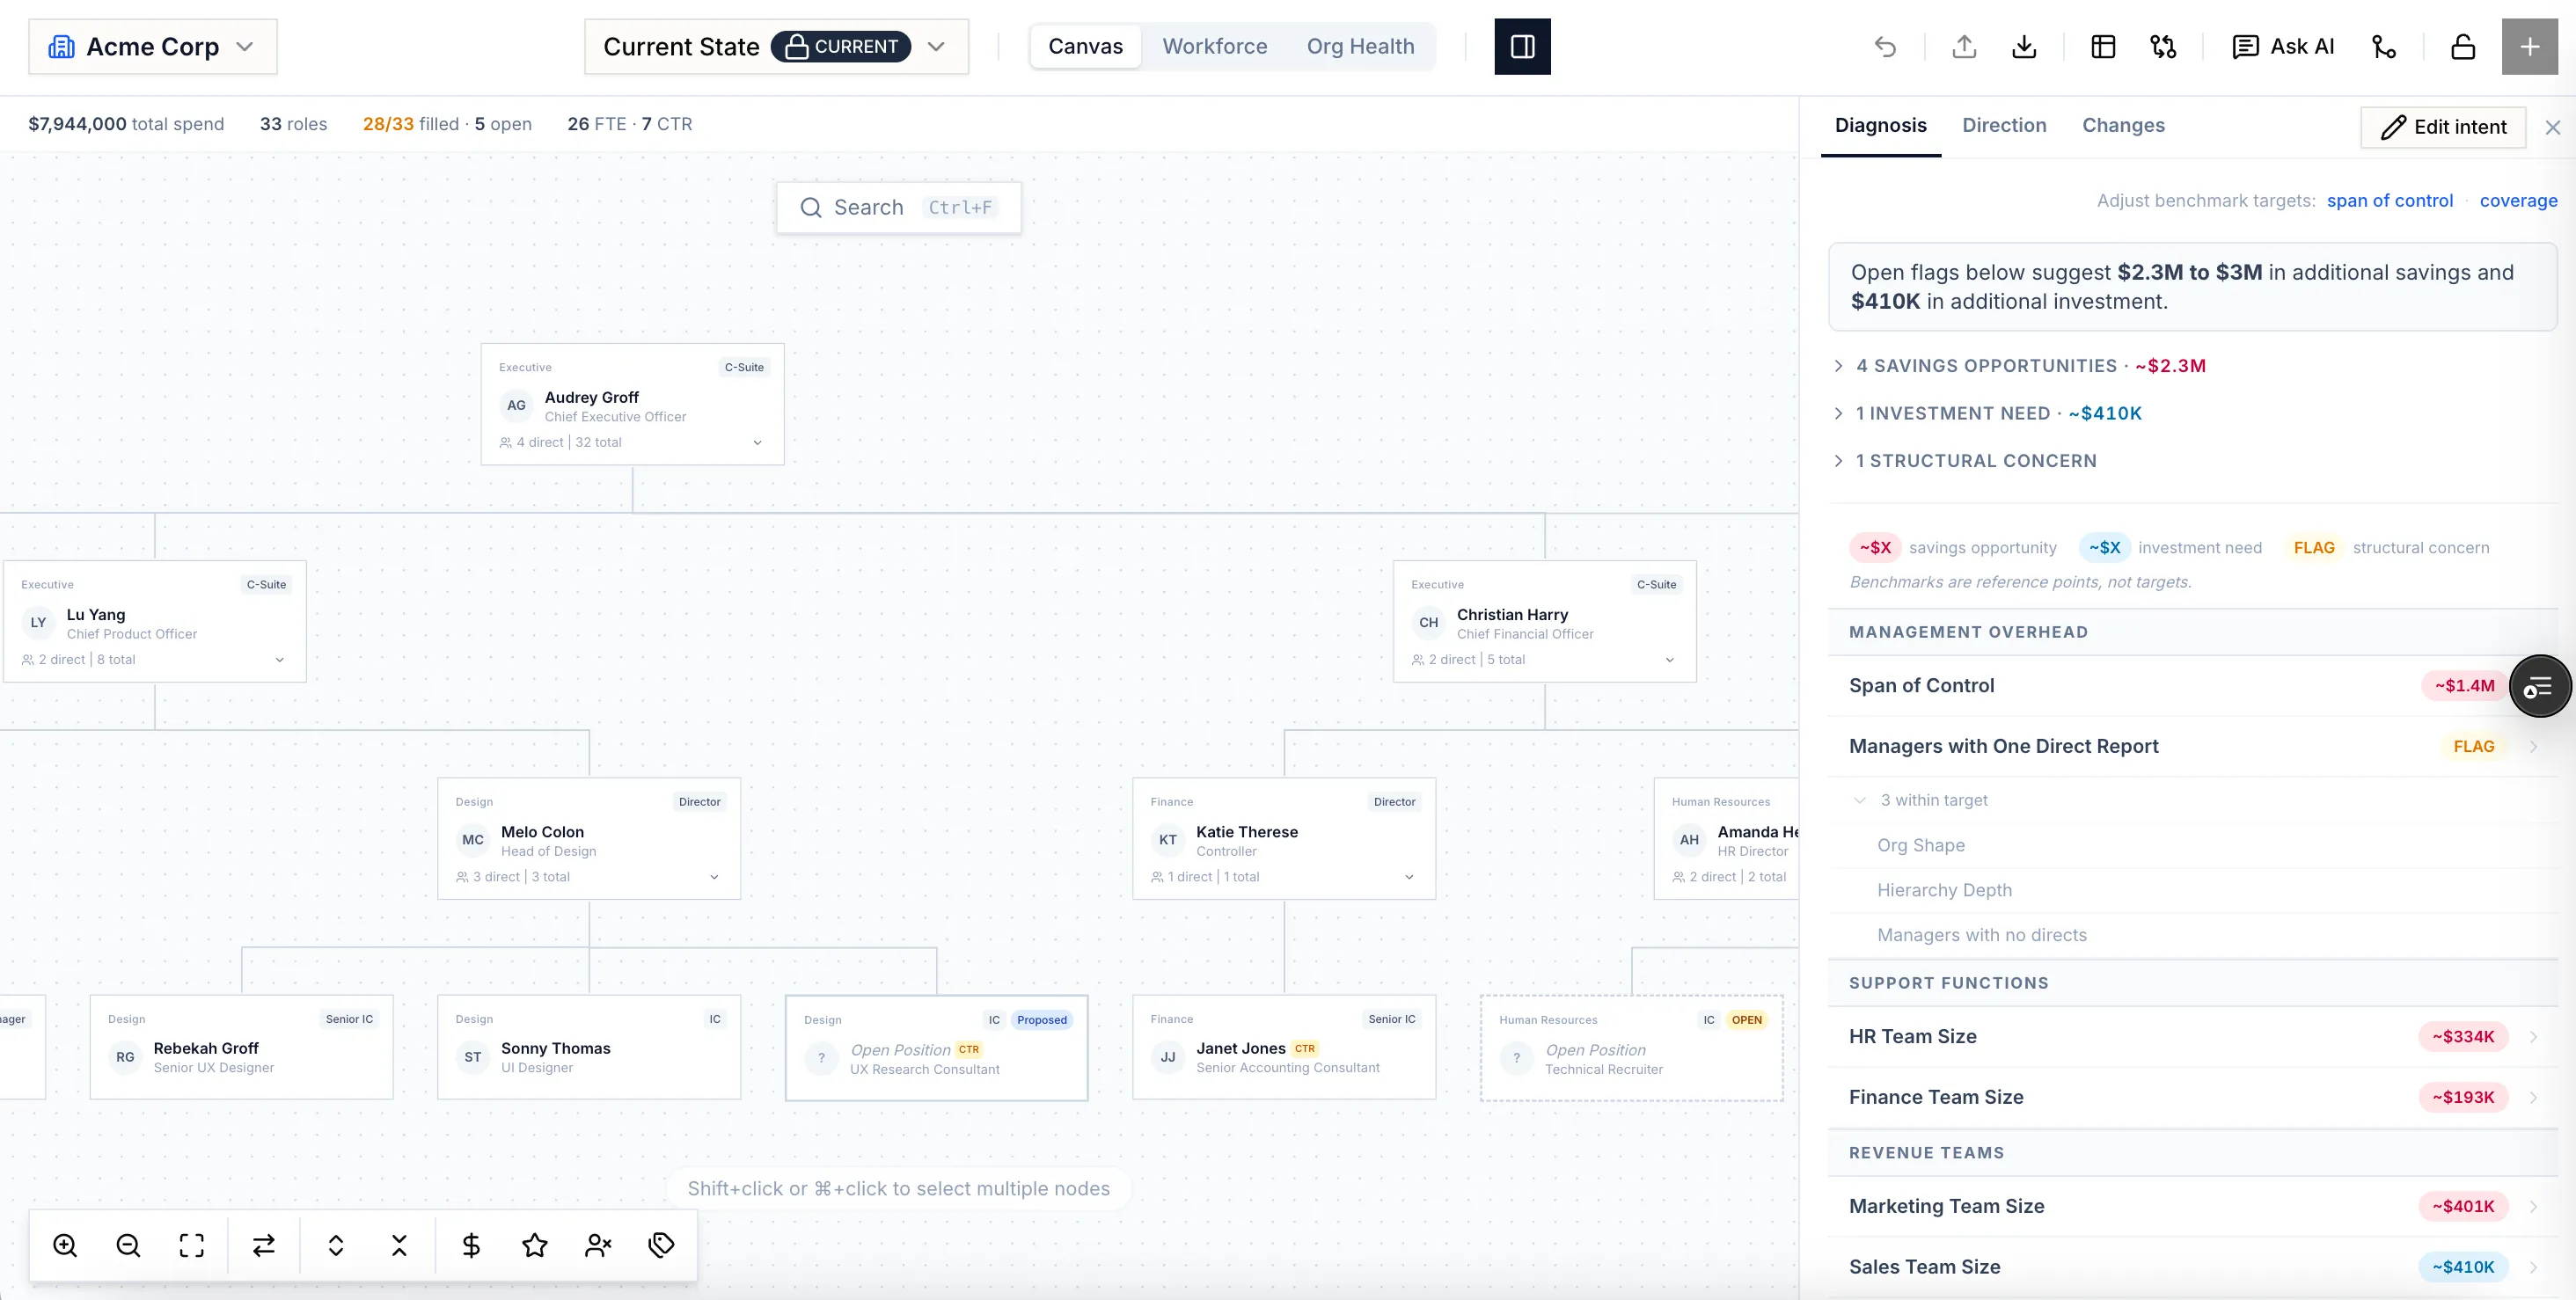
A diagram can't tell you where the org is overbuilt or top-heavy. Counting spans and layers in Lucidchart is manual, slow, and out of date the moment anything changes.
OrgDrafter continuously checks the design against your benchmarks and flags bloated layers and thin spans — each one explained and priced. And you can just ask the AI to fix it.
See how OrgDrafter stacks up.
Org design and financial analytics built for enterprise planning, without the lengthy rollout or a dedicated admin.
Explore vs. MiroTrade the infinite whiteboard of sticky-note boxes for a structured org model with cost, spans, and scenarios underneath.
Explore Replace ExcelTrade fragile spreadsheets and version-control chaos for one live workspace that models future-state scenarios without breaking the math.
ExploreTrade the diagram for a live model.
We'll turn the kind of org chart you draw in Lucidchart today into a model that does the math for you.